Two Adjacent High-rise Buildings with Rectangular plan
Introduction
The interference effects between high-rise buildings with two different planforms and arrangements are investigated by checking the pressure distributions on building faces. For the pressure measurement test, wind tunnel experiments were carried out in a boundary layer wind tunnel of Tokyo Polytechnic University. The test section is 2.2 m wide and 1.8 m high.
Totally four sets of experiments were conducted for the pressure measurement.
Case 1 : The square section model was the principal building and the rectangular section model was the interfering building.
Case 2 : The rectangular section model was the principal building and the square section model was the interfering building.
Case 3 : The parallel arrangements of two rectangular building models
Case 4 : The perpendicular arrangements of two rectangular models.
---Related journals----------
Mutual interference effects between two high-rise building models with different shapes on local peak pressure coefficients, Yi Hui, Yukio Tamura, Akihito Yoshida, Journal of Wind Engineering and Industrial Aerodynamics, Volumes 104–106, pp.98-108, May–July 2012, https://doi.org/10.1016/j.jweia.2012.04.004
Pressure and flow field investigation of interference effects on external pressures between high-rise buildings, Y.Hui, Y.Tamura, A.Yoshida, H.Kikuchi, Journal of Wind Engineering and Industrial Aerodynamics, Volume 115, April 2013, Pages 150-161
(https://www.sciencedirect.com/science/article/abs/pii/S016761051300038X)
Experiment Conditions
- [Approach flow]
-
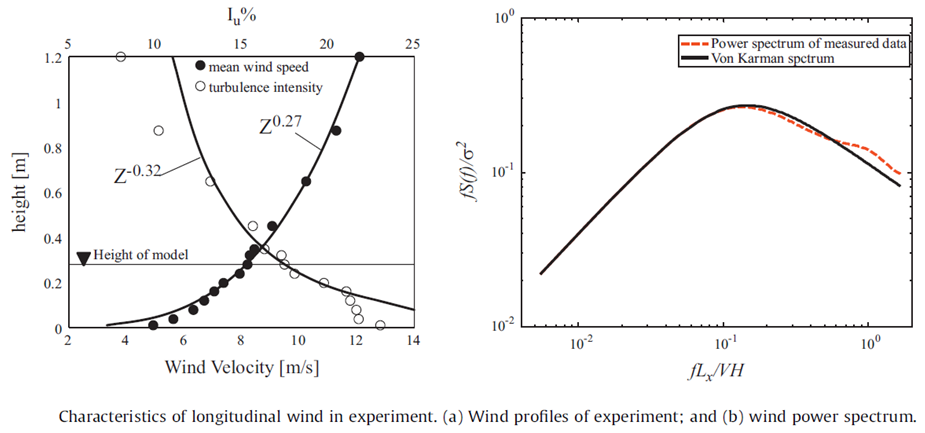
The approaching flow represented an urban wind exposure with a power law exponent of 0.27. The mean wind speed and the turbulence intensity at the roof height of the model were 8 m/s and 17%, respectively. Measured longitudinal mean wind velocities, turbulence intensity profiles and power spectrum of wind speeds at roof height is shown in below download file.
Power law index for mean wind speed : 0.27
Power law index for turbulent intensity : 0.32
Turbulent intensity at the top of the building : 0.17
- [Peak value evaluation]
-
The Cook–Mayne method (Cook and Mayne, 1980) was adopted to estimate the extreme pressure coefficient. The extreme pressure coefficient representing the 50-year return period was calculated
using the following equation:
minCp = Cp + 1.4/ac
where Cp and 1/ac are the mode and scale parameter respectively of the extreme pressure coefficient.
Number of samples of 10min in full-scale conversion : 5
(The uploaded time series corresponds to one 10-minute sample. If you need all 10-minute samples, please contact us.)


