High-rise Buildings with Various Configurations
Introduction
In this database, the wind pressures acting on high-rise buildings with various configurations based on the wind tunnel experiment were uploaded. Wind pressure measurements were conducted on 14 models. For more information, please refer to the following journal paper.
---Related journals----------
H. Tanaka, Y. Tamura, K. Ohtake, M. Nakai, Y.C. Kim, Experimental investigation of aerodynamic forces and wind pressures acting on tall buildings with various unconventional configurations, Journal of Wind Engineering and Industrial Aerodynamics, Volumes 107–108, pp.179-191, 2012
https://doi.org/10.1016/j.jweia.2012.04.014
Experiment Conditions
- Outline of experiment
-
The wind direction was changed from 0 to 355 deg. at 5 deg. intervals. The fluctuating wind pressures of each pressure tap were measured and recorded simultaneously using a vinyl tube 80 cm long through a multi-channel pressure transducer. The fluctuating wind pressures were revised considering the transfer function of the vinyl tube. The sampling frequency was 1 kHz with a low-pass filter of 500 Hz. The total number of data was 32,768. There were about 20 measurement points on one level on four surfaces, and the measurement points were instrumented at 10 levels (12 levels only for Setback Model), giving about 200 measurement points.
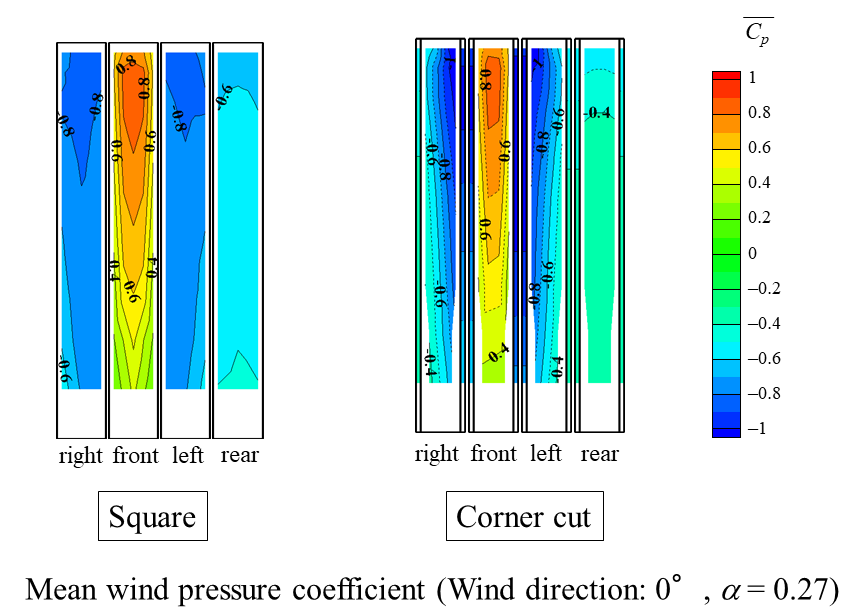
The wind pressure coefficients Cp were obtained by normalizing the pressures by the velocity pressure at model height.
----Experimental condition----------
Sampling rate : 1000Hz
Sampling period : 32.8 seconds (correspond to 9 samples of 600 seconds in fullscale)
Wind velocity at model height : 11.8 m /s
Turbulent length scale at the model height : 0.36m
----Example of scales----------
Geometrical scale : 1/1000
Velocity scale : 1/6 (In case of the wind speed at the building height is about 70 m/s in fullscale)
Time scale : 1/167 (In case of the velocity scale is 1/6)
- Approaching flow
-
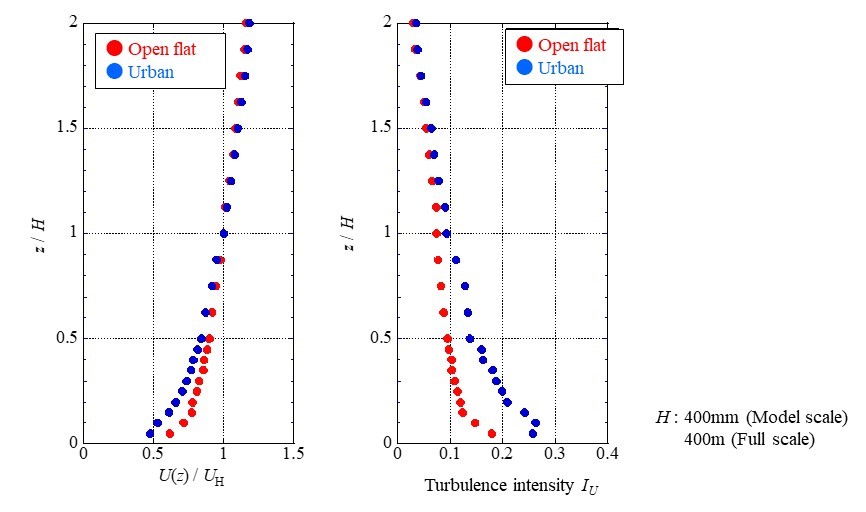
Two types of approaching flow were used for the wind pressure experiment.
- Open flat terrain (Power law index α = 0.15)
- Urban terrain (Power law index α = 0.27)


